Market Overview
17.6M+ verified resale transactions across GOAT & StockX, Oct 2024 - Present
Daily Sales Volume
Price Distribution
When Do People Buy?
Budget Heat Under $150
High-volume sneakers that won't break the bank — real style, real sales, real value.
Based on Feb 16 – Feb 23, 2026 sales data · Refreshed daily
🚀 Sleeper Picks
Under-the-radar shoes with surging week-over-week sales growth

Trending Now
What's hot and what's not in the sneaker resale market
Trending Up
Trending Down
Biggest Price Spreads
Products with the widest gap between min and max sale prices
Release Tracker
How hot was the drop? Track launch performance for recent releases
Recent Drops
Launch performance for shoes released in the last 30 days
Launch Day Sales Comparison
Daily sales curves for recent releases overlaid (days since release)
Upcoming Releases
Unreleased shoes with confirmed drop dates
Brand Battle
See how Nike, Jordan, adidas, and more compete on the resale market
Monthly Sales by Brand
Brand Market Share (by Sales)
Brand Market Share (by Revenue)
Model Tracker
Track price trends and popularity for the hottest silhouettes
Model Trends Over Time
Price Trends by Model (Avg, Min, Max)
Size Popularity by Brand
Top Sellers
The 200 highest-grossing sneakers on the resale market
Geographic Trends
Explore sneaker sales across the US. Click states, hover cities, use filters.
City Lookup
Search for any US city to see its top brands and models
Top 15 States by Sales
Top 30 US Cities
For each ambiguous city name, sales are allocated to possible locations proportionally to each location's population. This is the standard methodology used by the US Census Bureau, Nielsen, and market research firms for geographic allocation of sales data.
Formula: P(County_i | CityName) = Population_i / Sum(Population_all_same_name)
Market Insights
Data-driven observations about the sneaker resale market
Color & Style Trends
What colors and silhouettes dominate the resale market?
Color Pulse
Sales volume by color family across all tracked products
Color Trends Over Time
Color market share over time — which colors are gaining or losing popularity? (61 weeks)
Silhouette Market Share
Silhouette Breakdown
Brand Color DNA
What percentage of each brand's sales comes from each color
Hottest Colorways
The 24 top-selling products right now, tagged by primary color
Style Finder
Click a color to discover the top-selling sneakers in that palette
Sneaker Market vs The Economy
Unemployment correlations, buying patterns, brand shifts, and pricing trends from 14+ months of data
Unemployment Rate vs Monthly Sales Volume
US national unemployment rate overlaid with total sneaker sales per month
Unemployment Rate vs Average Sale Price
Does economic pressure affect what people pay for sneakers?
Weekly Sales Trend (61 Weeks)
Sneaker resale market volume over time — are people spending more or less?
Day-of-Week: Sales Volume
Which days do people buy the most sneakers?
Day-of-Week: Average Price
Does the day of the week affect what people spend?
Brand Market Share Over Time
How the top 6 brands' share of total sneaker sales has shifted over 15 months
Average Sale Price Trend
Weekly average sneaker sale price — tracking pricing power in the resale market
Sneakers vs Crypto
Do cryptocurrency markets and sneaker resale markets move together? 14 months of daily data reveals surprising connections.
The Big Picture: Sneakers vs Crypto (Normalized Index)
All values indexed to 100 at Dec 28, 2024 — showing relative performance over 14 months. This is how hedge funds compare asset classes.
Bitcoin Price vs Average Sneaker Price
The strongest relationship in our data: when Bitcoin drops, sneaker prices rise. Weekly averages smooth out daily noise.
Correlation Matrix
Pearson r values between crypto and sneaker metrics
Volatility Comparison
Daily price volatility (std dev of % changes) — which market swings more?
Altcoins vs Sneaker Sales Volume
ETH and SOL price trends vs weekly sneaker sales — do altcoin rallies predict sneaker buying sprees?
Sneakers vs Sports Betting
How US sports betting handle correlates with sneaker sales volume and pricing
Monthly Betting Handle vs Sneaker Sales
Sports Season Impact on Sneaker Sales
Betting Handle vs Avg Sneaker Price
Game Day vs Non-Game Day Sneaker Sales
Holidays & Cultural Events vs Sneaker Sales
How religious and cultural holidays impact sneaker purchase volume and pricing
Sneaker Sales Around Major Holidays
Holiday Impact: Sales Volume Change
Holiday Impact: Avg Price Change
Day-by-Day View: Top Holiday Periods
Sneaker Market vs SNAP Usage
County-level comparison of food assistance participation and sneaker resale activity across 3,100+ US counties
Interactive SNAP & Sneaker Map
Toggle between SNAP participation, sneaker activity, and average prices by state
SNAP Participation vs Sneaker Orders Per 10K Residents
Each bubble represents a state — size reflects total order volume. Regression line shows trend direction.
Orders Per 10K by SNAP Quintile
How sneaker purchase rates vary across SNAP usage tiers
Avg Sale Price by SNAP Quintile
Do people in high-SNAP areas buy cheaper or pricier sneakers?
Metro vs Small Town vs Rural
Comparing SNAP participation rates and sneaker buying behavior by area type
Brand Preferences by SNAP Level
Do communities with different economic profiles prefer different sneaker brands?
State-by-State: SNAP Rate vs Sneaker Activity
All 50 states sorted by SNAP participation with sneaker orders per 10K overlaid
Notable Counties: Where SNAP Meets Sneakers
Counties grouped into 4 quadrants based on SNAP participation and sneaker activity
Fear & Greed Index vs Sneaker Market
Advanced statistical analysis of CNN investor sentiment and sneaker resale activity across 8 methods
Investor Sentiment vs Sneaker Sales Over Time
CNN Fear & Greed Index (line) overlaid with daily sneaker sales volume (bars) — background bands show sentiment zones
Sneaker Sales by Sentiment Regime
Avg daily sales across 5 Fear & Greed classifications
Scatter: Sentiment vs Daily Sales
Each point = one day, colored by regime, OLS regression line
Cross-Correlation: Lead/Lag Analysis
Does Fear & Greed lead or lag sneaker sales? Correlation at time offsets from −14 to +14 days
30-Day Rolling Correlation
How stable is the relationship? Rolling Pearson r over time
Volatility Co-Movement
14-day rolling standard deviation of F&G changes vs sneaker sales changes
Sub-Indicator Decomposition
Which CNN Fear & Greed component correlates most with sneaker sales?
Year-over-Year & Seasonality Analysis
Decomposing sneaker resale patterns: seasonal cycles, day-of-week effects, and January 2025 vs 2026 comparison
Year-over-Year: January 2025 vs January 2026
Daily sales comparison for the first full overlapping month — day-by-day alignment
Monthly Seasonal Index
Each month's avg daily sales relative to overall average (1.0 = average)
Day-of-Week Effect
Average daily sales by weekday — reveals consistent buying patterns
Trend-Seasonal Decomposition
Additive decomposition: actual sales = trend (30-day MA) + day-of-week seasonal + residual
Weekly Volume: Year-over-Year
Overlapping ISO weeks compared across years
Anomaly Detection
Days with sales >2σ from 30-day rolling average — holidays, drops, spikes
Brand Market Share Shift: January 2025 vs 2026
Which brands gained or lost market share year-over-year?
Deseasonalized Daily Sales
Raw sales vs seasonally-adjusted — removes day-of-week and monthly cycles to reveal true trend
Buyer Patterns: Repeat Buyer Intelligence
11-method analysis of 4.5M+ sales identifies repeat buyers responsible for nearly 1 in 5 transactions on GOAT
Repeat Buyer Share of Market
Percentage of all GOAT sales attributable to identifiable repeat buyers (confidence score 8+)
Detection Methods
How many buyers/events each of the 10 analysis methods detected
Methodology: 11 Detection Methods
We use location + shoe size as a proxy for individual buyer identity. Click any method to learn how it works.
Key Findings
Top Model Collectors (Set Buying / FOG Pattern)
Models with the most identified collectors buying multiple colorways of the same silhouette
Brand Preference: Repeat Buyers vs Market
Index > 100 means repeat buyers over-index on this brand vs the general market
Household Buying Breakdown
Family purchase events detected: parent+child, couples, and full families buying in the same session
Top 20 Countries by Repeat Buyer Spend
International repeat buyers with 4+ purchases — where do the most dedicated non-US collectors live?
Top Repeat Buyer Locations
Whale Hotspots
Buyers who dominate their town's sneaker spending
When Repeat Buyers Shop (24hr)
Purchase volume by hour of day for identified repeat buyers — peak hours highlighted
Repeat Buyer Size Distribution
Which shoe sizes repeat buyers purchase most. Rare sizes (14+ / 5-) highlighted in red — these are the most identifiable buyers.
FOG Monthly Sales & Avg Price Trend
Fear of God / Essentials sales volume and average price over time
Top FOG Products by Sales
Most popular Fear of God products by total sales volume
FOG Size Distribution
Which apparel sizes FOG buyers purchase most
Top FOG Repeat Buyer Locations
Cities with the highest FOG repeat buyer spend — NYC dominates streetwear collecting
Top FOG Collectors
Individual fingerprints with the highest FOG spending — click to see details
Top Brands in Niche-Dominated Products
Which brands have the most products where a single location dominates 40%+ of sales
Niche Product Examples: One Buyer Dominates
Products with 5-50 total sales where a single location accounts for 40%+ — strong evidence of individual buyers purchasing uncommon items
Deep Demographic Analysis
Inferring buyer demographics from 17.6M+ transactions: size-based gender proxy, spending tiers, geographic penetration, and buyer lifecycle
Size Distribution Bell Curve
US shoe sizes across all sales — peaks reveal dominant buyer segments
Gender Proxy Split
Estimated male/female/youth breakdown based on shoe size ranges
Brand Preference by Size Segment
How brand market share shifts across Women's/Youth (3.5-7), Men's (7.5-13), and Large (14+) segments
Spending Tier Distribution
Transactions bucketed by price: budget to luxury
Revenue Share by Tier
Which spending segment drives the most revenue?
Income Proxy vs Average Spend by State
Inverse SNAP rate (proxy for median income) vs average sneaker transaction — each bubble is a state
Above vs Below Retail
What percentage of resale transactions exceed the original retail price?
Racial Diversity vs Sneaker Purchase Rate
State minority population % vs orders per 10K residents — bubble size = total sales volume, color = dominant minority group
Median Income vs Avg Spend
Do higher-income states spend more per sneaker transaction?
Education Quartile Analysis
States grouped by college attainment rate — sneaker demand by education level
Socioeconomic Index vs Sneaker Penetration
Composite SES score (income + education + employment + poverty) vs orders per 10K — top 25 states
Purchase Rate by Dominant Industry
States grouped by largest employment sector
Income Inequality vs Market Activity
Gini coefficient vs sneaker orders per 10K residents
Per-Capita Market Penetration by State
Population-adjusted sneaker orders per 10K residents — reveals true demand beyond raw volume
Metro vs Suburban vs Rural
Spending patterns and penetration by area type
Per-Capita Sneaker Spend
Annual revenue per capita by state (top 20)
New vs Returning Buyers Over Time
Monthly ratio of first-time vs repeat buyer fingerprints
Purchase Frequency Distribution
How many purchases does each buyer fingerprint make?
Spend Trajectory
Do buyers spend more on their 2nd, 3rd, nth purchase?
US vs International Split
Share of sales from domestic vs international buyers
Top Countries by Sales
Leading international markets by transaction count
Brand Preferences by Country
Do different countries prefer different sneaker brands?
Deep Dive: Jordan 11
Detailed breakdown of one of the most iconic silhouettes
Jordan 11 Colorway Rankings
Jordan 11 Price Trends by Colorway
Jordan 11 Volume Over Time
Sneaker Resale Market Overview
SneakerPulse tracks over 5.5M verified sneaker resale transactions totaling $955.3M in revenue across 104.3K unique products. Our data covers major resale marketplace activity from December 2024 through the present, updated daily with real transaction data.
This Week's Top Selling Sneaker
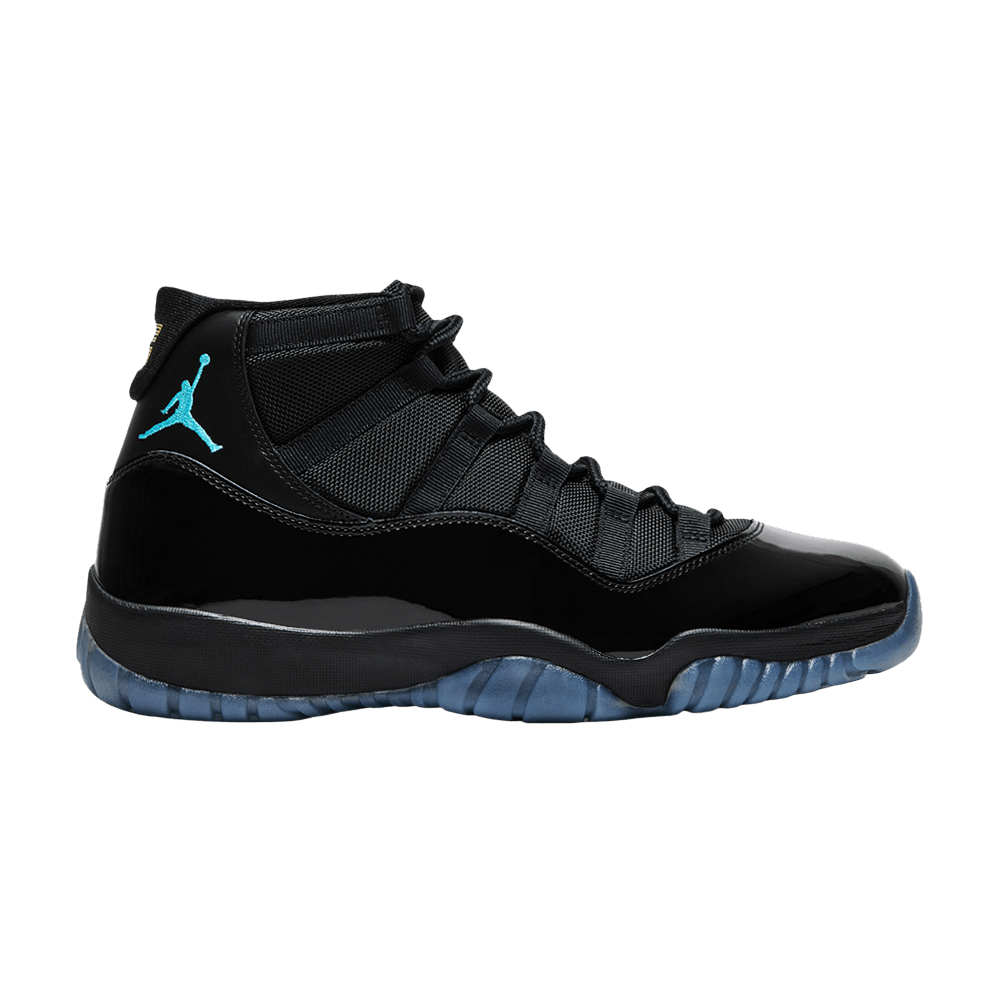
The Air Jordan 11 Retro 'Gamma Blue' 2025 by Air Jordan leads this week with 765 sales at an average resale price of $283, with prices ranging from $189 to $460.
Trending models: Yeezy Slide (+48.3%), Air Jordan 4 (+37.4%), Dunk (+27.8%), Forum (+20.0%), Gazelle (+19.5%)
Sleeper Picks: Rising Under-the-Radar Sneakers
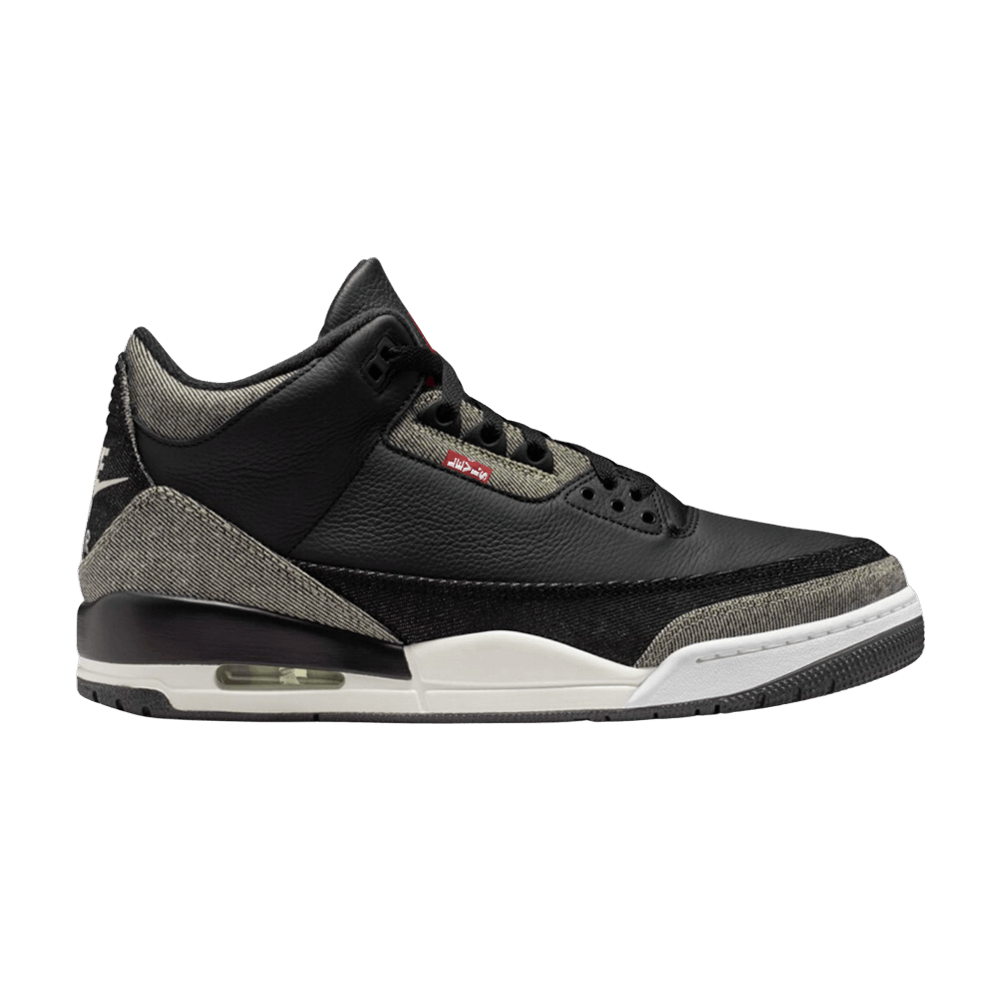
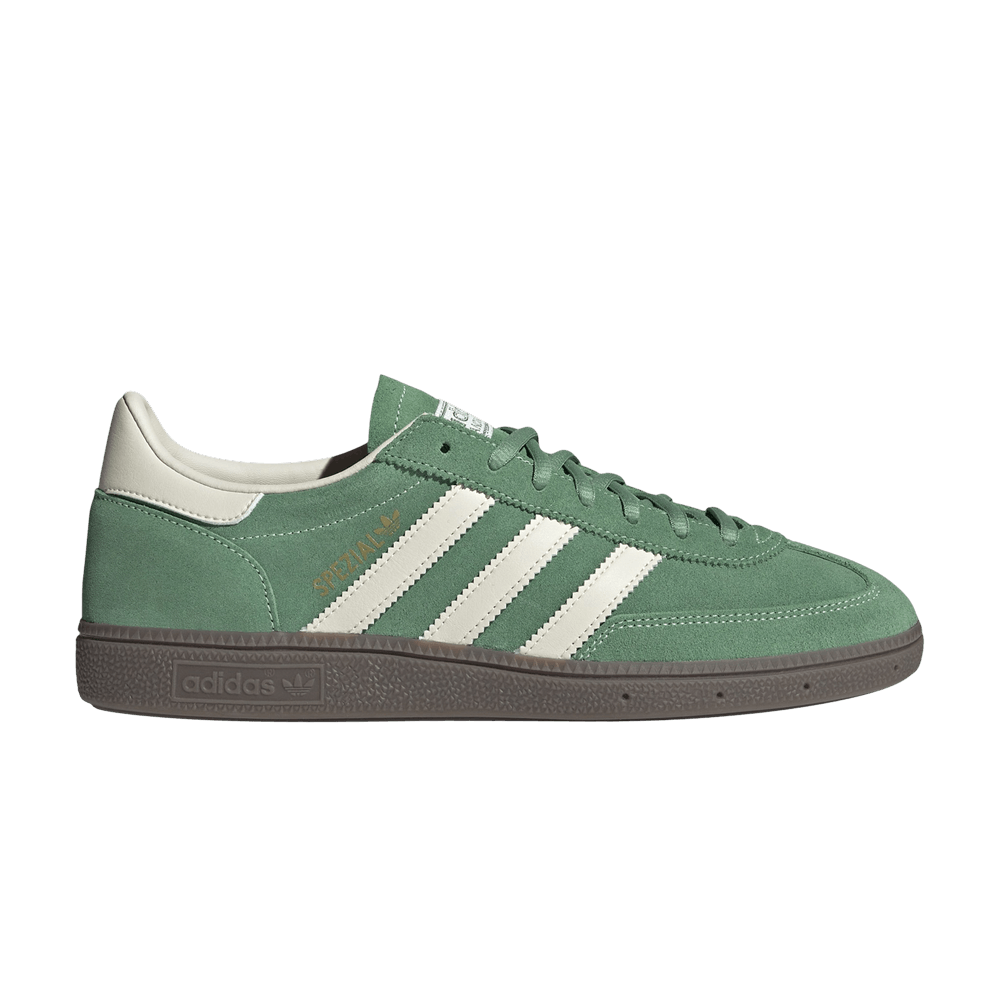
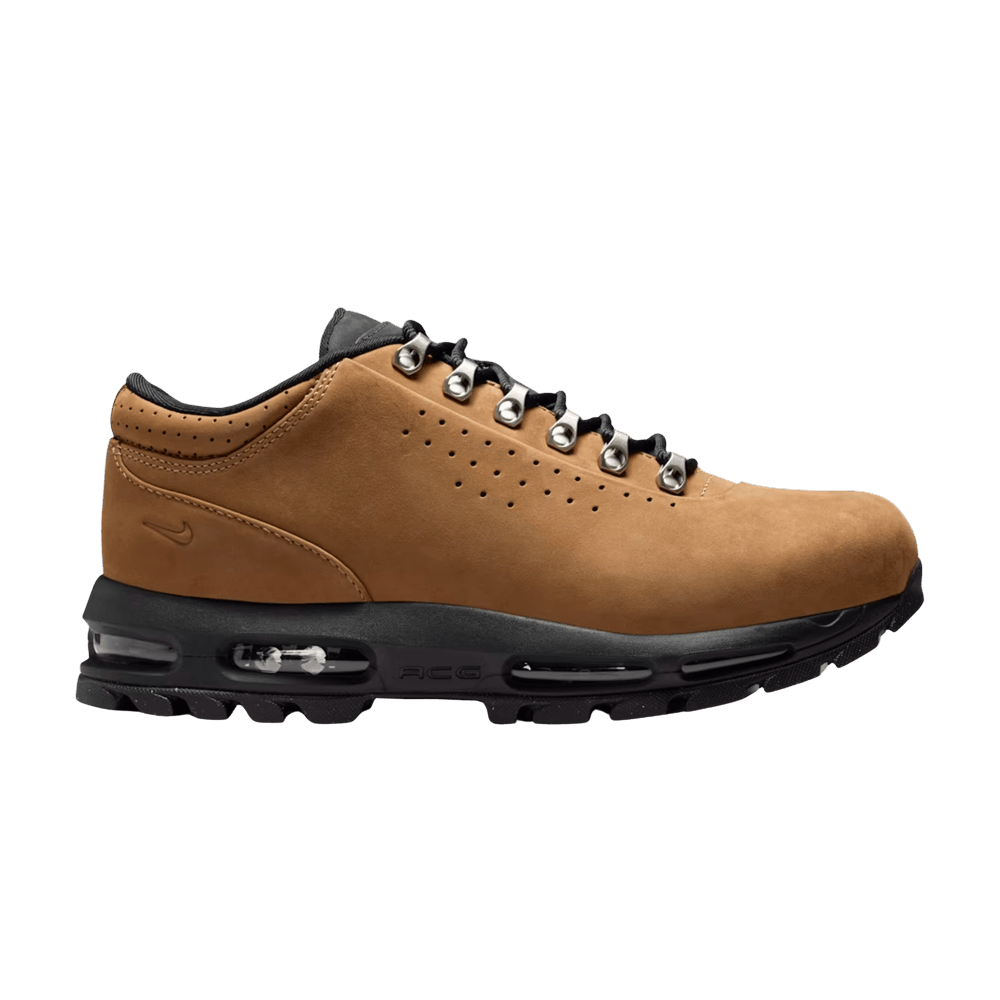
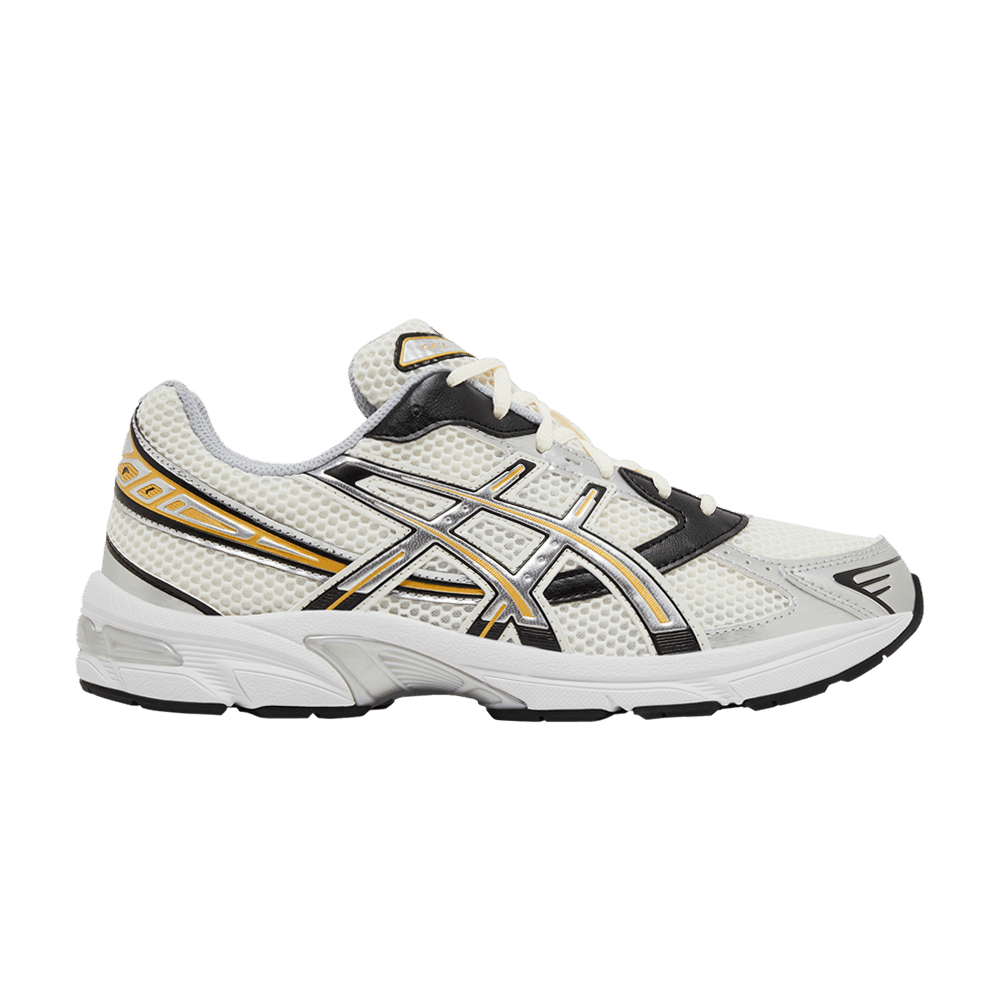
These shoes are seeing massive week-over-week sales growth: Air Jordan 1 Low OG 'Chinese New Year' 2026 (+4000.0% WoW, avg $170), Levi's x Air Jordan 3 Retro SP 'Black Denim' (+411.8% WoW, avg $249), Asics Gel 1130 'Black Pure Silver' (+229.0% WoW, avg $105), Adidas Handball Spezial 'Preloved Green Gum' (+225.0% WoW, avg $62), Nike Air Max Goadome Low 'Taupe' (+223.5% WoW, avg $229).
Budget Picks: Best Value Sneakers Under $150
Top affordable sneakers with strong resale volume: Asics Gel 1130 'Black Pure Silver' (avg $105, 329 sold), Timberland 6 Inch Premium Waterproof Boot 'Wheat' (avg $109, 286 sold), Asics Gel 1130 'White Pure Silver Black' (avg $113, 212 sold), Nike Air Force 1 '07 'Triple White' (avg $80, 184 sold), YZY YS-01 'Black' (avg $55, 127 sold).
Recent Sneaker Releases — Launch Performance
How hot were recent drops? Launch week sales performance for the latest releases:
| Sneaker | Release Date | Launch Week Sales | Avg Price | Hype |
|---|---|---|---|---|
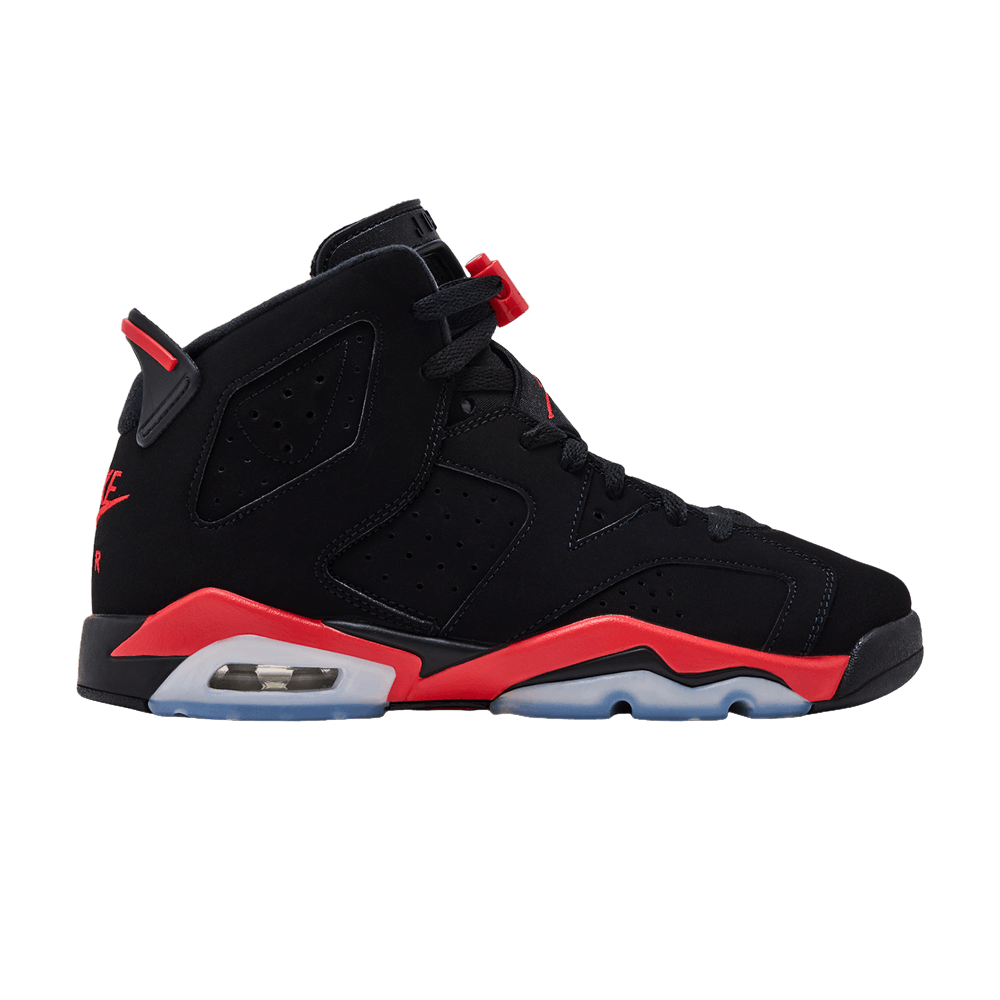
| Air Jordan 6 Retro 'Reverse Infrared Salesman' | 2026-02-14 | 2.5K | $237 | HOT |
| Fragment Design x Union LA x Air Jordan 1 Retro High OG 'Varsity Red' | 2026-02-14 | 1.6K | $364 | HOT |
| Nike Zoom Kobe 6 Protro '3D All-Star' | 2026-02-13 | 918 | $275 | HOT |
| Fragment Design x Union LA x Air Jordan 1 Retro High OG 'Sport Royal' | 2026-02-14 | 755 | $535 | HOT |
| Wmns Air Jordan 10 Retro 'Hydrangeas' | 2026-02-12 | 241 | $232 | WARM |
| Air Jordan 1 High Retro OG 'All-Star' | 2026-02-12 | 218 | $125 | WARM |
| Air Jordan 6 Retro GS 'Reverse Infrared Salesman' | 2026-02-14 | 199 | $128 | WARM |
| Air Jordan 1 Low OG 'Chinese New Year' 2026 | 2026-02-17 | 162 | $171 | WARM |
Upcoming Sneaker Releases
Confirmed upcoming releases: Jordan 11 Retro Gamma Blue (2025) (), YZY YS-01 Black (), Jordan 6 Retro Infrared Salesman (), Jordan 4 Retro Black Cat (2025) (), Jordan 1 Retro High OG SP Fragment x Union LA Varsity Red Sport Royal (), Maison Mihara Yasuhiro Hank OG Sole Canvas Low Black (), Nike Kobe 6 Protro ASG Hollywood 3D (2026) (), Jordan 4 Retro OG Flight Club (), Jordan 5 Retro Wolf Grey (2026) (), New Balance 9060 Triple Black ().
Brand Market Share — 2026-02
| Brand | Sales | Revenue | Avg Price |
|---|---|---|---|
| Air Jordan | 165.9K | $41.8M | $252 |
| Nike | 64.0K | $12.8M | $200 |
| adidas | 24.4K | $3.5M | $144 |
| New Balance | 12.5K | $1.5M | $119 |
| ASICS | 16.5K | $2.2M | $131 |
Top Sneaker Resale Markets by State
The top sneaker resale markets are: California (493.9K sales), New York (357.2K sales), Texas (343.6K sales), Florida (297.7K sales), Illinois (195.9K sales).
Popular Sneaker Resale Prices
Current average resale prices based on verified marketplace transactions:
| Sneaker | Avg Price | Low | High | Sales |
|---|---|---|---|---|
| Air Jordan 11 Retro 'Gamma Blue' 2025 | $301 | $95 | $582 | 53.4K |
| Fear of God Essentials Fleece Sweatpant 'Black' | $64 | $25 | $300 | 15.0K |
| Air Jordan 4 Retro 'Flight Club' | $190 | $51 | $330 | 14.8K |
| Air Jordan 6 Retro 'Reverse Infrared Salesman' | $248 | $154 | $550 | 13.8K |
| Fear of God Essentials Fleece Sweatpant 'Light Heather Grey' | $62 | $24 | $216 | 12.6K |
| Supreme x Hanes Crew Socks (4 Pack) 'White' | $19 | $14 | $55 | 11.4K |
| Air Jordan 4 Retro GS 'Black Cat' 2025 | $193 | $86 | $463 | 10.3K |
| Fear of God Essentials Fleece Hoodie II 'Desert Sand' | $68 | $39 | $177 | 10.1K |
| Nike Mind 001 'Black' | $245 | $111 | $599 | 10.0K |
| Nike Air Force 1 '07 'Triple White' | $81 | $29 | $193 | 9.4K |
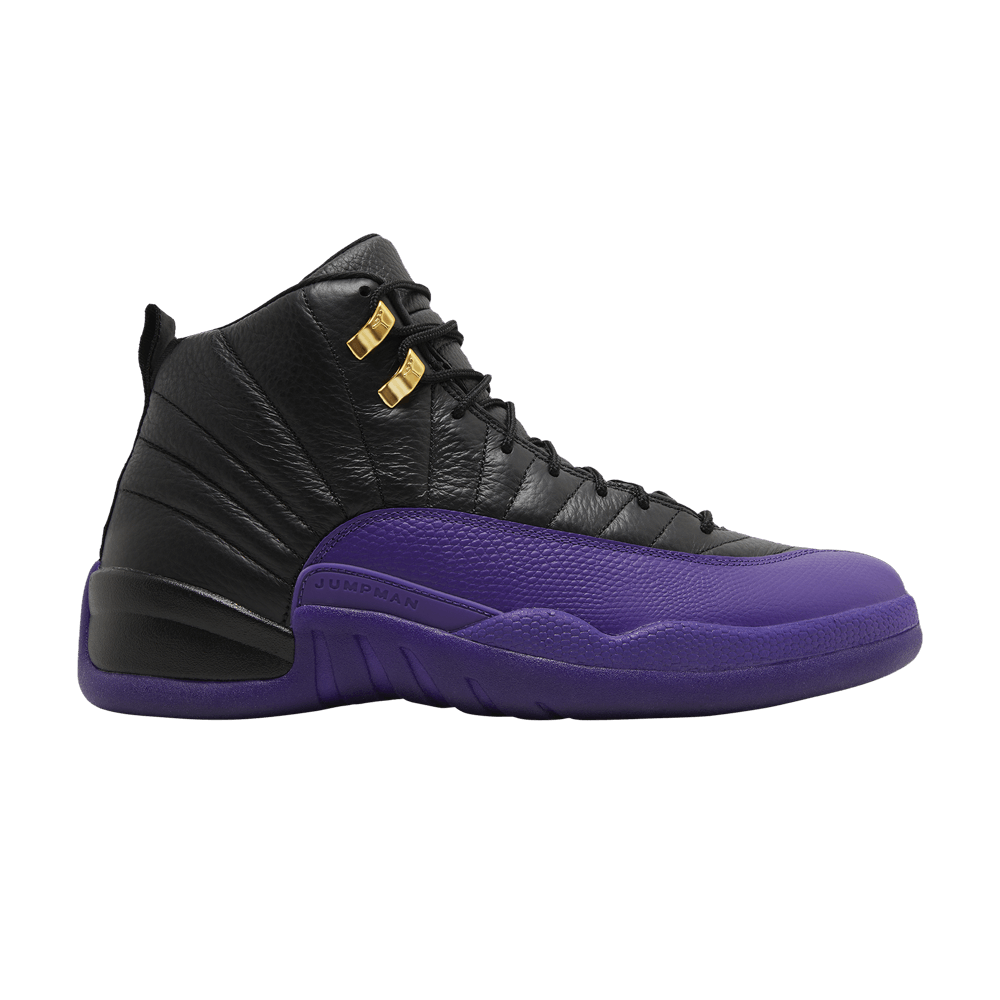
| Air Jordan 12 Retro 'Taxi' 2025 | $202 | $110 | $650 | 9.3K |
| Air Jordan 11 Retro GS 'Gamma Blue' 2025 | $259 | $113 | $520 | 9.1K |
| Wmns Air Jordan 4 Retro 'Valentine's Day' | $238 | $175 | $444 | 8.5K |
| Air Jordan 8 Retro 'Bugs Bunny' 2025 | $193 | $105 | $545 | 8.2K |
| Caitlin Clark x Nike Zoom Kobe 5 Protro 'Indiana Fever' | $299 | $185 | $700 | 7.1K |
| YZY YS-01 'Black' | $50 | $25 | $189 | 6.9K |
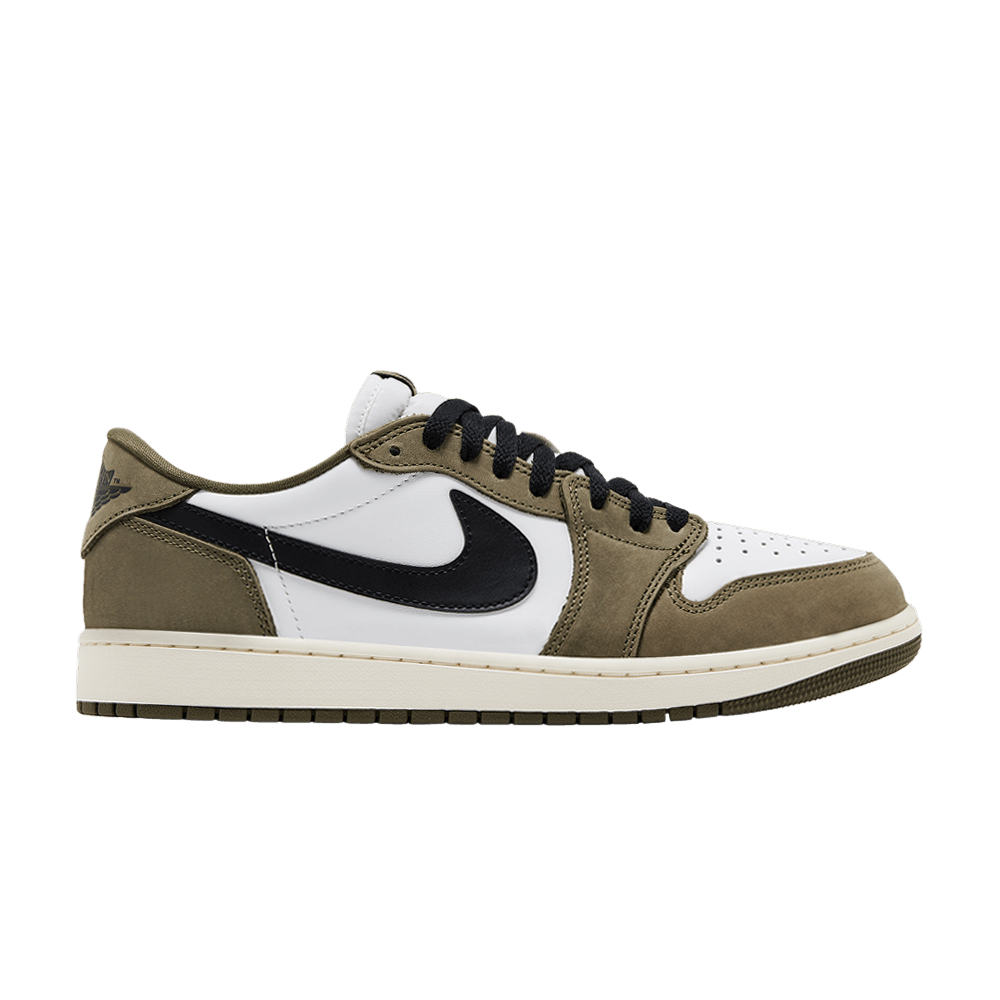
| Fragment Design x Travis Scott x Air Jordan 1 Retro Low OG SP 'Sail Military Blue' | $1.1K | $128 | $1.5K | 6.8K |
| Fragment Design x Union LA x Air Jordan 1 Retro High OG 'Varsity Red' | $391 | $265 | $1.9K | 6.8K |
| Fear of God Essentials Fleece Hoodie 'Crimson' | $63 | $44 | $182 | 6.6K |
| Air Jordan 1 Retro Low OG 'Medium Olive' | $150 | $88 | $299 | 6.2K |
Sneaker Color Trends
Which colors dominate the sneaker resale market? Here are the top color families by sales volume:
| Color Family | Sales | Products | Revenue |
|---|---|---|---|
| Black | 116.0K | 1594 | $24.1M |
| White | 94.2K | 1737 | $19.2M |
| Grey | 34.6K | 742 | $5.9M |
| Blue | 29.2K | 539 | $7.8M |
| Red | 26.4K | 529 | $5.7M |
| Green | 9.4K | 262 | $2.0M |
| Gold | 9.1K | 306 | $1.8M |
| Cream | 6.5K | 126 | $2.3M |
| Pink | 5.9K | 157 | $999.2K |
| Brown | 5.0K | 127 | $1.1M |
| Purple | 3.3K | 84 | $669.8K |
| Orange | 1.9K | 114 | $489.0K |
Sneaker Silhouette Trends
Silhouette market share breakdown: High (86.8K sales, 553 models), Runner (35.4K sales, 960 models), Mid (24.1K sales, 107 models), Low (17.5K sales, 379 models), Slide (3.7K sales, 86 models).
Hottest Colorways Right Now
The top-selling colorways on the resale market: Air Jordan 11 Retro 'Gamma Blue' 2025 (Black, 15.3K sales), Fear of God Essentials Fleece Sweatpant 'Black' (Black, 4.3K sales), Air Jordan 4 Retro 'Flight Club' (White, 4.2K sales), Air Jordan 6 Retro 'Reverse Infrared Salesman' (Black, 3.9K sales), Fear of God Essentials Fleece Sweatpant 'Light Heather Grey' (Grey, 3.6K sales), Supreme x Hanes Crew Socks (4 Pack) 'White' (White, 3.2K sales), Air Jordan 4 Retro GS 'Black Cat' 2025 (Black, 2.9K sales), Fear of God Essentials Fleece Hoodie II 'Desert Sand' (Multi, 2.9K sales), Nike Mind 001 'Black' (Black, 2.9K sales), Nike Air Force 1 '07 'Triple White' (White, 2.7K sales).
Sneaker Market vs Unemployment
Analyzing the relationship between US unemployment rates and sneaker resale market activity. Moderate positive correlation (r=0.57) between unemployment and sneaker sales volume.
| Month | Unemployment | Sneaker Sales | Avg Price |
|---|---|---|---|
| 2024-12 | 4.1% | 280.6K | $171 |
| 2025-01 | 4.0% | 330.9K | $156 |
| 2025-02 | 4.2% | 330.8K | $192 |
| 2025-03 | 4.2% | 364.6K | $185 |
| 2025-04 | 4.2% | 369.8K | $172 |
| 2025-05 | 4.3% | 412.9K | $172 |
| 2025-06 | 4.1% | 371.6K | $169 |
| 2025-07 | 4.3% | 436.1K | $160 |
| 2025-08 | 4.3% | 525.1K | $162 |
| 2025-09 | 4.4% | 319.3K | $171 |
| 2025-10 | N/A | 325.0K | $167 |
| 2025-11 | 4.5% | 443.9K | $176 |
| 2025-12 | 4.4% | 502.5K | $182 |
| 2026-01 | 4.3% | 379.8K | $190 |
| 2026-02 | N/A | 339.2K | $194 |
Sneakers vs Cryptocurrency
Analysis of 14 months of aligned daily data reveals a strong inverse correlation (r=-0.76) between Bitcoin price and average sneaker sale price. When crypto markets decline, sneaker resale prices tend to rise.
Sneaker sales volume shows 15.09% daily volatility compared to Bitcoin's 2.36%, making the sneaker resale market significantly more volatile on a day-to-day basis.
Sneakers vs Sports Betting
US commercial sports betting handle shows a 0.24 correlation with average sneaker prices across 14 months of data. Betting handle vs sales volume: r=-0.32.
Major sports events impact sneaker sales: Super Bowl LX saw a +21.3% change in daily sneaker sales around the event.
Holidays & Cultural Events vs Sneaker Sales
Analysis of 28 holidays and cultural events shows significant impact on sneaker sales patterns. Cyber Monday had the largest positive impact with a +71.8% increase in daily sales.
Christian holidays average +29.3% sales change.
Cultural holidays average +11.0% sales change.
Hindu holidays average +1.4% sales change.
Islamic holidays average -6.8% sales change.
Jewish holidays average -12.1% sales change.
Explore by Brand
- Air Jordan Resale Analytics
- Nike Resale Analytics
- adidas Resale Analytics
- New Balance Resale Analytics
- ASICS Resale Analytics
- Puma Resale Analytics
- Converse Resale Analytics
- Vans Resale Analytics
Explore by Model
- 2002R Price History
- 574 Price History
- 990 Price History
- Air Force 1 Price History
- Air Jordan 1 Price History
- Air Jordan 11 Price History
- Air Jordan 4 Price History
- Air Max 1 Price History
- Air Max 270 Price History
- Air Max 90 Price History
- Air Max 95 Price History
- Air Max 97 Price History
- Air Max Plus Price History
- Air VaporMax Price History
- Blazer Price History
- Chuck 70 Price History
- Dunk Price History
- Dunk SB Price History
- Forum Price History
- Gazelle Price History
- NMD Runner Price History
- Samba Price History
- Superstar Price History
- UltraBoost Price History
- Yeezy Boost 350 Price History
- Yeezy Slide Price History
Explore by State
- Alabama Sneaker Market
- Alaska Sneaker Market
- Arizona Sneaker Market
- Arkansas Sneaker Market
- California Sneaker Market
- Colorado Sneaker Market
- Connecticut Sneaker Market
- Delaware Sneaker Market
- District of Columbia Sneaker Market
- Florida Sneaker Market
- Georgia Sneaker Market
- Hawaii Sneaker Market
- Idaho Sneaker Market
- Illinois Sneaker Market
- Indiana Sneaker Market
- Iowa Sneaker Market
- Kansas Sneaker Market
- Kentucky Sneaker Market
- Louisiana Sneaker Market
- Maine Sneaker Market
- Maryland Sneaker Market
- Massachusetts Sneaker Market
- Michigan Sneaker Market
- Minnesota Sneaker Market
- Mississippi Sneaker Market
- Missouri Sneaker Market
- Montana Sneaker Market
- Nebraska Sneaker Market
- Nevada Sneaker Market
- New Hampshire Sneaker Market
- New Jersey Sneaker Market
- New Mexico Sneaker Market
- New York Sneaker Market
- North Carolina Sneaker Market
- North Dakota Sneaker Market
- Ohio Sneaker Market
- Oklahoma Sneaker Market
- Oregon Sneaker Market
- Pennsylvania Sneaker Market
- Puerto Rico Sneaker Market
- Rhode Island Sneaker Market
- South Carolina Sneaker Market
- South Dakota Sneaker Market
- Tennessee Sneaker Market
- Texas Sneaker Market
- Utah Sneaker Market
- Vermont Sneaker Market
- Virginia Sneaker Market
- Washington Sneaker Market
- West Virginia Sneaker Market
- Wisconsin Sneaker Market
- Wyoming Sneaker Market
Repeat Buyer Analysis
Our 10-method buyer fingerprinting analysis of 4.5 million GOAT marketplace sales identifies 89,484 repeat buyers responsible for 18.4% of all transactions and $141 million in revenue. Using location and shoe size as a proxy for individual identity, we detect habitual buyers, household purchasing (27,550 couples, 9,052 parent-child, 4,988 families), brand loyalists, whale spenders, international collectors across 119 countries, and model set-buyers who collect every colorway of silhouettes like the Air Jordan 1 (6,311 collectors) and Air Jordan 4 (5,292 collectors). Notable findings include Netherlands Air Max 1 obsessives, Shenzhen commercial operations with 2,100+ purchases, and near-certain individual identification of Size 15+ collectors in small towns.